The U.S. added about 22.7 million people between 2010 and 2020. That’s a 7.4% increase, making it one of the slowest growth decades on record.
Growth wasn’t evenly distributed. While some areas barely moved, others expanded at a pace that reshaped their housing markets, job base, and daily life. Cities like Fort Worth and Phoenix added well over 100,000 residents. In places like Enterprise, Nevada, the population more than doubled.
These migration patterns also reflect longer-term shifts in how and where people work, with remote work trends making it easier for many households to move farther from traditional job centers.
Large Cities: Growth at Scale
Among the country’s largest cities (350,000+ residents), Fort Worth led the way with nearly 24% growth, adding more than 177,000 residents over the decade.
Austin and Seattle followed closely, both growing more than 21%, though with much steeper increases in housing costs.
A few patterns stand out:
- Texas leads the pack. Fort Worth and Austin take the top two spots, with Dallas and Houston also ranking.
- The Mountain West gained momentum. Denver, Aurora, and Colorado Springs all placed in the top 25.
- The Midwest had a rare breakout. Omaha quietly ranked among the fastest-growing large cities.
10. Bakersfield, CA - 16.11% Growth
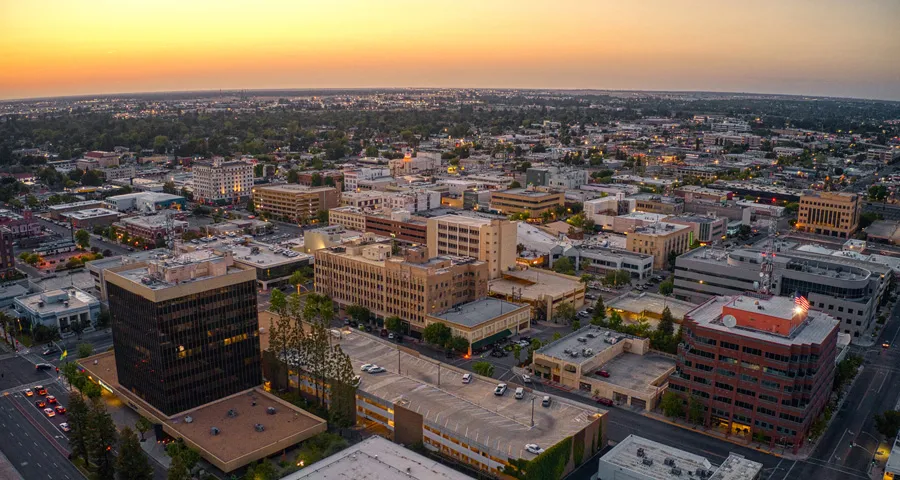
2010 Population | 347,483 | 2020 Population | 403,455 |
10-Year Growth | 55,972 | Growth Rate | 16.11% |
Household Income | $73,827 | Median Home Value | $320,600 |
Bakersfield added nearly 56,000 residents over the decade, serving as one of California’s more affordable alternatives to coastal markets.
As housing costs climbed in cities like Los Angeles and San Francisco, many residents looked inland. Bakersfield’s lower home prices attracted younger families and workers, reflected in its median age of just 31.5, the youngest among the top 10.
The local economy remains tied to agriculture and energy, which can create more variability in employment. Still, its relative affordability continues to position it as a destination for those priced out of other parts of the state.
9. Oklahoma City, OK - 17.42% Growth

2010 Population | 579,999 | 2020 Population | 681,054 |
10-Year Growth | 101,055 | Growth Rate | 17.42% |
Household Income | $64,251 | Median Home Value | $196,700 |
Oklahoma City added more than 100,000 residents between 2010 and 2020 while remaining one of the most affordable large cities in the country.
Unlike many high-growth markets, housing costs stayed relatively low, with both home values and rents well below national averages. That affordability made it an attractive option for buyers seeking space without the price pressures of larger metros.
Long-term investment in infrastructure and downtown development also contributed to its growth. With a median age just under 35 and manageable commute times, Oklahoma City offers a model of expansion that balances cost and livability.
8. Atlanta, GA - 18.74% Growth

2010 Population | 420,003 | 2020 Population | 498,715 |
10-Year Growth | 78,712 | Growth Rate | 18.74% |
Household Income | $77,655 | Median Home Value | $395,600 |
Atlanta added nearly 79,000 residents over the decade, reinforcing its role as the economic center of the Southeast.
The city attracted both corporate investment and a growing workforce, supported by industries ranging from finance and logistics to media and film production. It also stands out for its high level of educational attainment, with more than half of residents holding a bachelor’s degree or higher.
Atlanta has one of the youngest populations among large cities in this group, with a median age of 33.6. That combination of job growth and younger residents has helped sustain demand across both housing and employment.
7. Aurora, CO - 18.82% Growth
2010 Population | 325,078 | 2020 Population | 386,261 |
10-Year Growth | 61,183 | Growth Rate | 18.82% |
Household Income | $78,685 | Median Home Value | $409,700 |
Aurora grew alongside the broader Denver metro area, adding more than 61,000 residents between 2010 and 2020.
Positioned just east of Denver, it provided a more affordable entry point into a rapidly expanding region. Many residents commute to nearby job centers, particularly in healthcare, retail, and the military, with Buckley Space Force Base located within the city.
Aurora is also one of the more diverse cities in Colorado, with a significant foreign-born population. While commute times tend to be longer than in some other cities on this list, its relative affordability continues to drive steady growth.
6. Omaha, NE - 18.85% Growth

2010 Population | 408,958 | 2020 Population | 486,051 |
10-Year Growth | 77,093 | Growth Rate | 18.85% |
Household Income | $70,202 | Median Home Value | $210,300 |
Omaha grew by nearly 19% over the decade, making it one of the more surprising entries among the fastest-growing large cities.
Unlike many peers, its growth wasn’t driven by rapid price increases or a single dominant industry. Instead, Omaha benefited from economic stability, a diverse employment base, and a relatively high concentration of major employers for a city of its size.
Affordability played a key role. With one of the lowest median home values among top-performing large cities and shorter commute times averaging just over 17 minutes, Omaha offered a quality-of-life advantage that quietly attracted new residents.
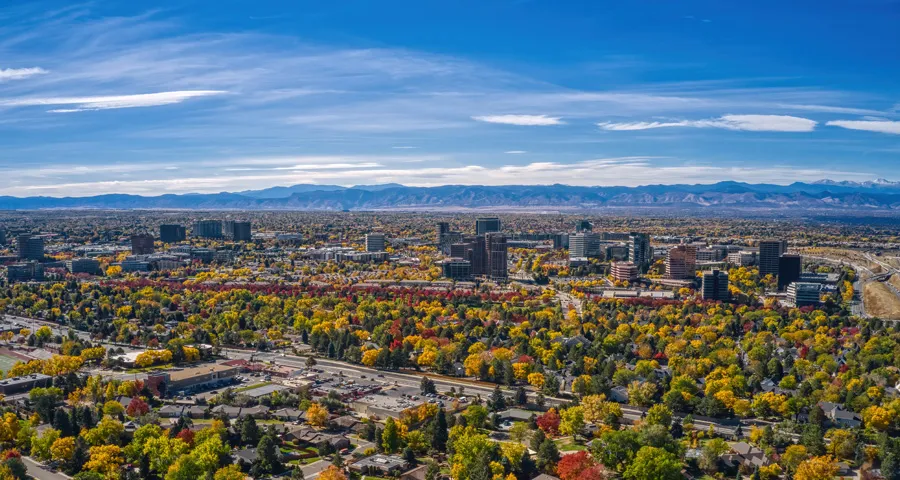
5. Denver, CO - 19.22% Growth

2010 Population | 600,158 | 2020 Population | 715,522 |
10-Year Growth | 115,364 | Growth Rate | 19.22% |
Household Income | $85,853 | Median Home Value | $540,400 |
Denver added more than 115,000 residents over the decade, fueled by a combination of job growth and lifestyle appeal.
The city attracted a younger, highly educated population, supported by a diverse economy spanning technology, healthcare, energy, and aerospace. Access to outdoor recreation and a strong cultural scene also played a role in its sustained growth.
As demand increased, so did housing costs. Denver transitioned from a more affordable alternative to a higher-priced market, with home values rising significantly over the decade. Its relatively young population and moderate commute times continue to make it attractive despite those increases.
4. Charlotte, NC - 19.57% Growth

2010 Population | 731,424 | 2020 Population | 874,579 |
10-Year Growth | 143,155 | Growth Rate | 19.57% |
Household Income | $74,070 | Median Home Value | $312,800 |
Charlotte added more than 143,000 residents between 2010 and 2020, making it one of the largest population gainers among major U.S. cities.
Long known as a major banking center, Charlotte continued to expand its economic base with growth in technology and other industries. Compared to larger East Coast metros, it maintained a more accessible cost of living, which helped attract both companies and workers.
The city’s relatively young population, with a median age of 34.5, and steady in-migration of educated professionals contributed to sustained demand. Charlotte’s growth reflects a mix of economic opportunity and relative affordability within the Southeast.
3. Seattle, WA - 21.09% Growth

2010 Population | 608,660 | 2020 Population | 737,015 |
10-Year Growth | 128,355 | Growth Rate | 21.09% |
Household Income | $116,068 | Median Home Value | $879,900 |
Seattle added more than 128,000 residents over the decade, driven largely by the expansion of its tech sector.
Amazon’s growth played a central role, bringing a surge of high-income workers into the city and pushing Seattle to one of the highest median household incomes among large U.S. cities. That demand also had a direct impact on housing, with home values rising sharply over the same period.
The city is also one of the most highly educated in the country, with nearly two-thirds of residents holding a bachelor’s degree or higher. Combined with a relatively young median age and manageable commute times, Seattle’s growth reflects a model driven by high wages rather than affordability.
2. Austin, TX - 21.69% Growth

2010 Population | 790,390 | 2020 Population | 961,855 |
10-Year Growth | 171,465 | Growth Rate | 21.69% |
Household Income | $86,556 | Median Home Value | $461,500 |
Austin was one of the fastest-growing large U.S. cities of the decade, adding more than 171,000 residents between 2010 and 2020.
That growth was largely driven by its emergence as a major technology hub. Expansions from companies like Tesla, Apple, and Oracle attracted a highly educated workforce, helping push Austin toward one of the highest shares of college-educated residents among large cities.
The trade-off has been affordability. Home values climbed quickly as demand increased, reshaping what was once considered a relatively accessible housing market. Austin also skews younger, with a median age of 34.2, and benefits from shorter commute times compared to many peer cities, reinforcing its appeal for both workers and employers.
1. Fort Worth, TX - 23.98% Growth

2010 Population | 741,206 | 2020 Population | 918,915 |
10-Year Growth | 177,709 | Growth Rate | 23.98% |
Houshold Income | $72,726 | Median Home Value | $250,300 |
Fort Worth was the fastest-growing large U.S. city between 2010 and 2020, adding nearly 178,000 residents over the decade. Much of that growth comes down to balance. It offers access to the broader Dallas–Fort Worth job market without the same housing pressure seen in nearby cities like Austin or Denver.
Unlike many high-growth metros, Fort Worth managed to absorb new residents without a dramatic spike in home prices, keeping it within reach for a wider range of buyers.
The city also skews relatively young, with a median age of 33.2, and offers shorter-than-average commutes for a metro of its size. Combined with a diverse economy spanning aerospace, logistics, healthcare, and finance, that mix has made it one of the more sustainable growth stories of the past decade.
Full List of Large Cities
City | 2010 Population | 2020 Population | Growth | Growth % | Median HH Income | Median Home Value | |
|---|---|---|---|---|---|---|---|
1 | Fort Worth, TX | 741,206 | 918,915 | 177,709 | 23.98% | $72,726 | $250,300 |
2 | Austin, TX | 790,390 | 961,855 | 171,465 | 21.69% | $86,556 | $461,500 |
3 | Seattle, WA | 608,660 | 737,015 | 128,355 | 21.09% | $116,068 | $879,900 |
4 | Charlotte, NC | 731,424 | 874,579 | 143,155 | 19.57% | $74,070 | $312,800 |
5 | Denver, CO | 600,158 | 715,522 | 115,364 | 19.22% | $85,853 | $540,400 |
6 | Omaha, NE | 408,958 | 486,051 | 77,093 | 18.85% | $70,202 | $210,300 |
7 | Aurora, CO | 325,078 | 386,261 | 61,183 | 18.82% | $78,685 | $409,700 |
8 | Atlanta, GA | 420,003 | 498,715 | 78,712 | 18.74% | $77,655 | $395,600 |
9 | Oklahoma City, OK | 579,999 | 681,054 | 101,055 | 17.42% | $64,251 | $196,700 |
10 | Bakersfield, CA | 347,483 | 403,455 | 55,972 | 16.11% | $73,827 | $320,600 |
11 | Raleigh, NC | 403,892 | 467,665 | 63,773 | 15.79% | $78,631 | $347,000 |
12 | Jacksonville, FL | 821,784 | 949,611 | 127,827 | 15.55% | $64,138 | $243,000 |
13 | Columbus, OH | 787,033 | 905,748 | 118,715 | 15.08% | $62,994 | $212,500 |
14 | Colorado Springs, CO | 416,427 | 478,961 | 62,534 | 15.02% | $79,026 | $383,000 |
15 | Mesa, AZ | 439,041 | 504,258 | 65,217 | 14.85% | $73,766 | $327,700 |
16 | Tampa, FL | 335,709 | 384,959 | 49,250 | 14.67% | $66,802 | $333,200 |
17 | Nashville, TN | 601,222 | 689,447 | 88,225 | 14.67% | $71,328 | $351,400 |
18 | Washington, DC | 601,723 | 689,545 | 87,822 | 14.60% | $101,722 | $705,000 |
19 | Oakland, CA | 390,724 | 440,646 | 49,922 | 12.78% | $94,389 | $883,800 |
20 | Sacramento, CA | 466,488 | 524,943 | 58,455 | 12.53% | $78,954 | $450,500 |
21 | Minneapolis, MN | 382,578 | 429,954 | 47,376 | 12.38% | $76,332 | $328,700 |
22 | Portland, OR | 583,776 | 652,503 | 68,727 | 11.77% | $85,876 | $523,100 |
23 | New Orleans, LA | 343,829 | 383,997 | 40,168 | 11.68% | $51,116 | $281,500 |
24 | Phoenix, AZ | 1,445,632 | 1,608,139 | 162,507 | 11.24% | $72,092 | $340,200 |
25 | Miami, FL | 399,457 | 442,241 | 42,784 | 10.71% | $54,858 | $433,900 |
Midsize Cities: Where Buyers Are Moving
If large cities show where jobs are concentrated, midsize cities (150,000–349,999) show where people actually moved.
The fastest-growing midsize cities were overwhelmingly suburbs of major metros like Dallas, Phoenix, Las Vegas, and Charlotte.
Enterprise, Nevada led the group, more than doubling its population.
Texas again stands out:
- Frisco grew more than 70%
- McKinney grew nearly 49%
- Several other suburbs posted strong gains
Across the board, the formula is consistent:
- Proximity to major job centers
- Lower housing costs than urban cores
- New construction keeping pace with demand
For many households, these cities offered the best balance of affordability and access.
Rank | City | 2010 Population | 2020 Population | Growth | Growth % | Median HH Income | Median Home Value |
|---|---|---|---|---|---|---|---|
1 | Enterprise, NV | 108,481 | 221,831 | 113,350 | 104.49% | $91,165 | $413,800 |
2 | Frisco, TX | 116,989 | 200,509 | 83,520 | 71.39% | $144,567 | $531,400 |
3 | McKinney, TX | 131,117 | 195,308 | 64,191 | 48.96% | $113,286 | $400,400 |
4 | Irvine, CA | 212,375 | 307,670 | 95,295 | 44.87% | $122,948 | $1,025,700 |
5 | Murfreesboro, TN | 108,755 | 152,769 | 44,014 | 40.47% | $70,451 | $327,400 |
6 | Santa Clarita, CA | 176,320 | 228,673 | 52,353 | 29.69% | $116,186 | $669,200 |
7 | Cary, NC | 135,234 | 174,721 | 39,487 | 29.20% | $125,317 | $477,400 |
8 | Orlando, FL | 238,300 | 307,573 | 69,273 | 29.07% | $66,292 | $332,700 |
9 | Gilbert, AZ | 208,453 | 267,918 | 59,465 | 28.53% | $115,179 | $454,300 |
10 | Cape Coral, FL | 154,305 | 194,016 | 39,711 | 25.74% | $72,474 | $302,400 |
11 | Clarksville, TN | 132,929 | 166,722 | 33,793 | 25.42% | $62,688 | $213,200 |
12 | Charleston, SC | 120,083 | 150,227 | 30,144 | 25.10% | $83,891 | $438,900 |
13 | Sioux Falls, SD | 153,888 | 192,517 | 38,629 | 25.10% | $71,785 | $250,000 |
14 | Port St. Lucie, FL | 164,603 | 204,851 | 40,248 | 24.45% | $75,040 | $292,900 |
15 | Durham, NC | 228,330 | 283,506 | 55,176 | 24.17% | $74,710 | $316,600 |
16 | Bellevue, WA | 122,363 | 151,854 | 29,491 | 24.10% | $149,551 | $1,139,500 |
17 | Peoria, AZ | 154,065 | 190,985 | 36,920 | 23.96% | $86,759 | $383,600 |
18 | Henderson, NV | 257,729 | 317,610 | 59,881 | 23.23% | $85,311 | $427,900 |
19 | North Las Vegas, NV | 216,961 | 262,527 | 45,566 | 21.00% | $71,774 | $340,200 |
20 | Spring Valley, NV | 178,395 | 215,597 | 37,202 | 20.85% | $69,341 | $375,200 |
21 | Killeen, TX | 127,921 | 153,095 | 25,174 | 19.68% | $57,086 | $175,400 |
22 | Huntsville, AL | 180,105 | 215,006 | 34,901 | 19.38% | $67,874 | $236,300 |
23 | Irving, TX | 216,290 | 256,684 | 40,394 | 18.68% | $76,686 | $259,500 |
24 | Jersey City, NJ | 247,597 | 292,449 | 44,852 | 18.11% | $91,151 | $500,100 |
25 | Vancouver, WA | 161,791 | 190,915 | 29,124 | 18.00% | $73,626 | $403,400 |
Notable: High-Cost Growth Still Happened
Cities like Irvine, CA and Bellevue, WA grew rapidly despite already high home prices.
In both cases, proximity to major tech employers helped sustain demand. These markets show that strong job centers can drive growth even when affordability is no longer a selling point.
Small Cities: Where Growth Is Spreading Next
Small cities (100,000–149,999) tell the most expansive version of this trend.
These are often outer-ring suburbs or emerging metros that crossed the 100,000 population mark during the decade.
Meridian, Idaho led the group, growing more than 56%.
A few patterns stand out:
- Texas dominates again, especially around Houston and Dallas
- Idaho emerges as a fast-growing region, particularly near Boise
- Florida suburbs continue to expand outward
In many cases, these cities aren’t driven by a single industry. Instead, they benefit from being more affordable alternatives within larger metro areas that have become too expensive for many buyers.
Rank | City | 2010 Population | 2020 Population | Growth | Growth % | Median HH Income | Median Home Value |
|---|---|---|---|---|---|---|---|
1 | Meridian, ID | 75,092 | 117,635 | 42,543 | 56.65% | $93,296 | $425,800 |
2 | Riverview, FL | 71,050 | 107,396 | 36,346 | 51.16% | $87,383 | $292,700 |
3 | Kent, WA | 92,411 | 136,588 | 44,177 | 47.80% | $86,966 | $478,400 |
4 | Sugar Land, TX | 78,817 | 111,026 | 32,209 | 40.87% | $132,247 | $387,900 |
5 | Pearland, TX | 91,252 | 125,828 | 34,576 | 37.89% | $111,123 | $311,100 |
6 | League City, TX | 83,560 | 114,392 | 30,832 | 36.90% | $117,316 | $312,500 |
7 | Concord, NC | 79,066 | 105,240 | 26,174 | 33.10% | $83,480 | $288,100 |
8 | Menifee, CA | 77,519 | 102,527 | 25,008 | 32.26% | $87,871 | $442,600 |
9 | Lehigh Acres, FL | 86,784 | 114,287 | 27,503 | 31.69% | $59,733 | $231,500 |
10 | Edinburg, TX | 77,100 | 100,243 | 23,143 | 30.02% | $54,139 | $159,600 |
11 | College Station, TX | 93,857 | 120,511 | 26,654 | 28.40% | $52,397 | $305,800 |
12 | Clovis, CA | 95,631 | 120,124 | 24,493 | 25.61% | $98,554 | $420,700 |
13 | Roseville, CA | 118,788 | 147,773 | 28,985 | 24.40% | $112,265 | $596,700 |
14 | Allen, TX | 84,246 | 104,627 | 20,381 | 24.19% | $121,259 | $390,200 |
15 | Denton, TX | 113,383 | 139,869 | 26,486 | 23.36% | $71,921 | $296,100 |
16 | Nampa, ID | 81,557 | 100,200 | 18,643 | 22.86% | $67,346 | $289,400 |
17 | The Woodlands, TX | 93,847 | 114,436 | 20,589 | 21.94% | $142,384 | $456,400 |
18 | Surprise, AZ | 117,517 | 143,148 | 25,631 | 21.81% | $87,756 | $352,600 |
19 | Richardson, TX | 99,223 | 119,469 | 20,246 | 20.40% | $94,362 | $379,800 |
20 | Sparks, NV | 90,264 | 108,445 | 18,181 | 20.14% | $82,938 | $423,500 |
21 | Round Rock, TX | 99,887 | 119,468 | 19,581 | 19.60% | $91,888 | $337,500 |
22 | Thornton, CO | 118,772 | 141,867 | 23,095 | 19.44% | $95,064 | $445,200 |
23 | Fargo, ND | 105,549 | 125,990 | 20,441 | 19.37% | $64,432 | $254,900 |
24 | Midland, TX | 111,147 | 132,524 | 21,377 | 19.23% | $90,448 | $280,700 |
25 | Rio Rancho, NM | 87,521 | 104,046 | 16,525 | 18.88% | $78,978 | $246,700 |
Notable: The Houston Suburbs
Sugar Land, Pearland, and League City all ranked near the top.
These are higher-income suburban communities with strong job access to Houston. They highlight a specific type of growth: buyers trading urban density for space without giving up employment opportunities.
What the Data Really Shows
Why Texas Keeps Winning Population Growth
No state appears more consistently across all three city sizes than Texas.
Growth isn’t limited to one metro either. Dallas, Houston, Austin, and their surrounding suburbs all contributed.
Key factors include:
- No state income tax
- Strong job creation
- Fewer constraints on housing supply
The Trade-Off: Growth vs. Affordability
Some cities managed to grow quickly while staying affordable. Fort Worth, Oklahoma City, and Omaha are good examples.
Others, like Seattle, Austin, and Denver, saw prices rise alongside population growth.
The pattern is clear. Affordable growth exists, but it’s becoming harder to sustain.
This trend aligns with broader national patterns in U.S. housing price data, where home values have risen steadily alongside demand in high-growth markets.
Education, Jobs, and Rising Home Prices
Cities with higher education levels tended to have:
- Higher incomes
- Higher home values
Many of these high-growth cities also benefited from steady job creation, supported by broader trends in U.S. employment data, which shows consistent expansion in sectors like technology, healthcare, and logistics over the past decade.
Meanwhile, cities with lower education levels often remained more affordable, supported by industries like logistics, manufacturing, and energy.
Why Suburbs Dominated the Decade
This shift toward suburban living aligns with findings from the National Association of Realtors, which has consistently reported strong demand for larger homes and more space, particularly among buyers leaving urban cores.
From Frisco outside Dallas to Meridian near Boise, the pattern repeats:
- Close to jobs
- More space
- Lower costs
For many households, this shift comes down to a simple cost-versus-lifestyle question, which is why comparisons like buying vs. renting have become increasingly relevant in fast-growing suburban markets.
Methodology
Population figures reflect official U.S. Census Bureau Decennial Census counts as of April 1, 2010 and April 1, 2020. The Decennial Census is the most authoritative measure of population for geographic and governmental purposes. Supplemental data, including income, home values, rent, and commute times, comes from the 2022 American Community Survey 5-Year Estimates. These figures are estimates and should be interpreted as directional context rather than exact counts. Cities were grouped by population size and ranked based on percentage growth over the decade.