
New Census data just released on January 26, 2026, shows a distinct group of U.S. cities saw ownership rise sharply over the past ten years.
Homeownership has become harder to attain across much of the United States, shaped by rising housing costs, higher interest rates, and limited supply. But that experience hasn’t been uniform. Newly released Census data shows that between 2014 and 2024, many incorporated U.S. cities recorded meaningful increases in the share of households that own their homes.
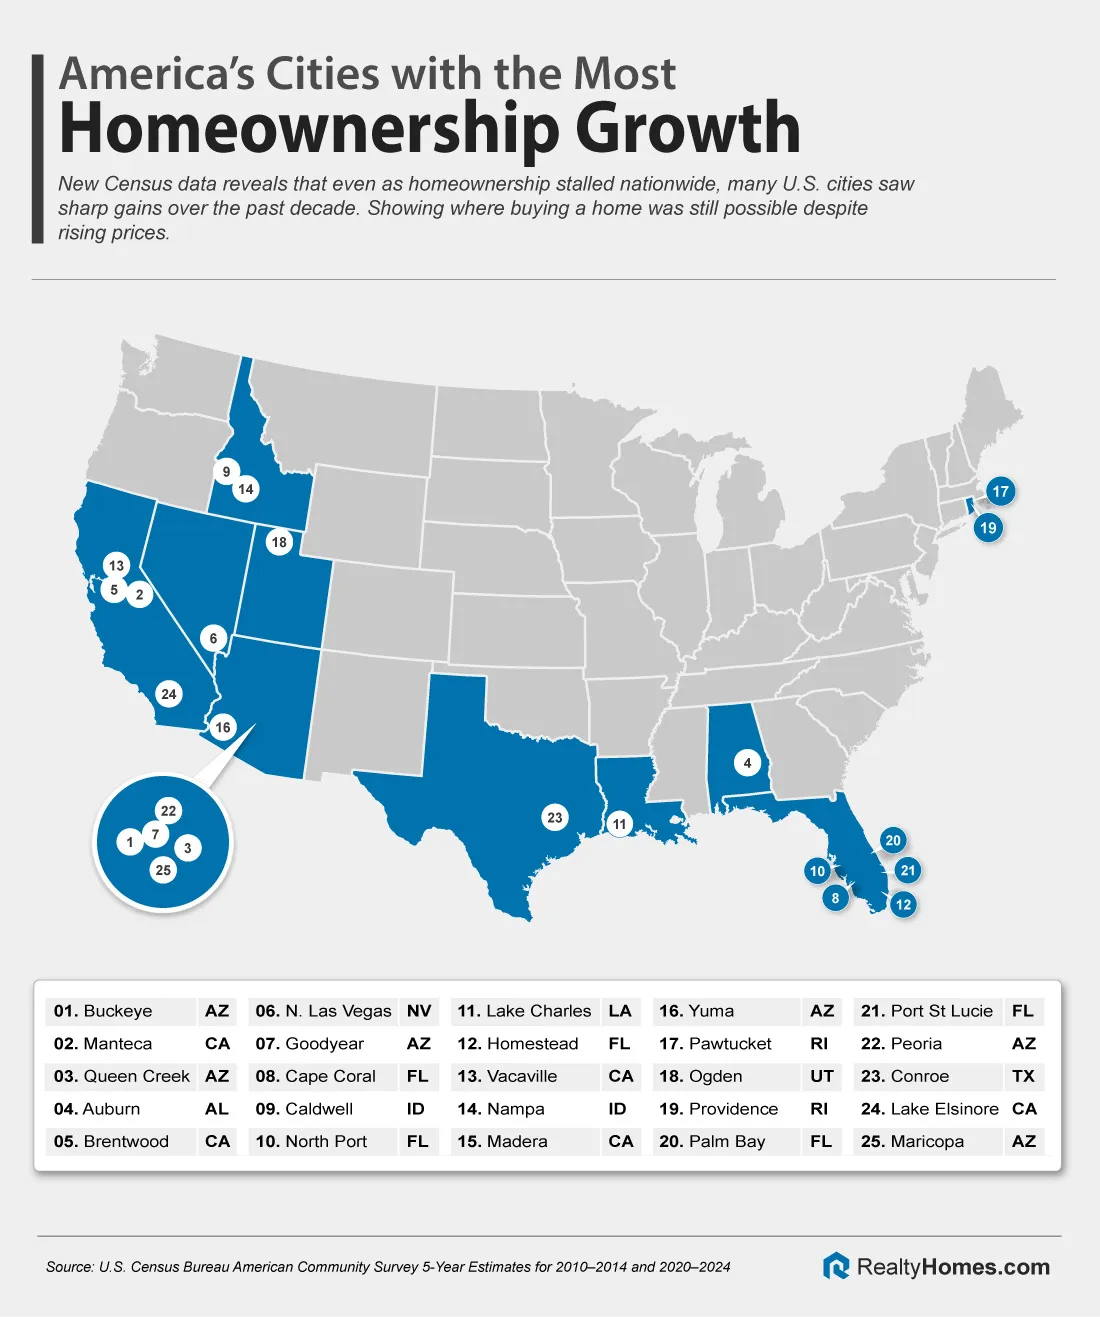
Top 10 Cities Where Homeownership Grew the Most
The cities below recorded the largest percentage-point increases in homeownership between 2014 and 2024. In many cases, gains of this size reflect sustained housing construction, population growth, and home prices that remained attainable relative to incomes.
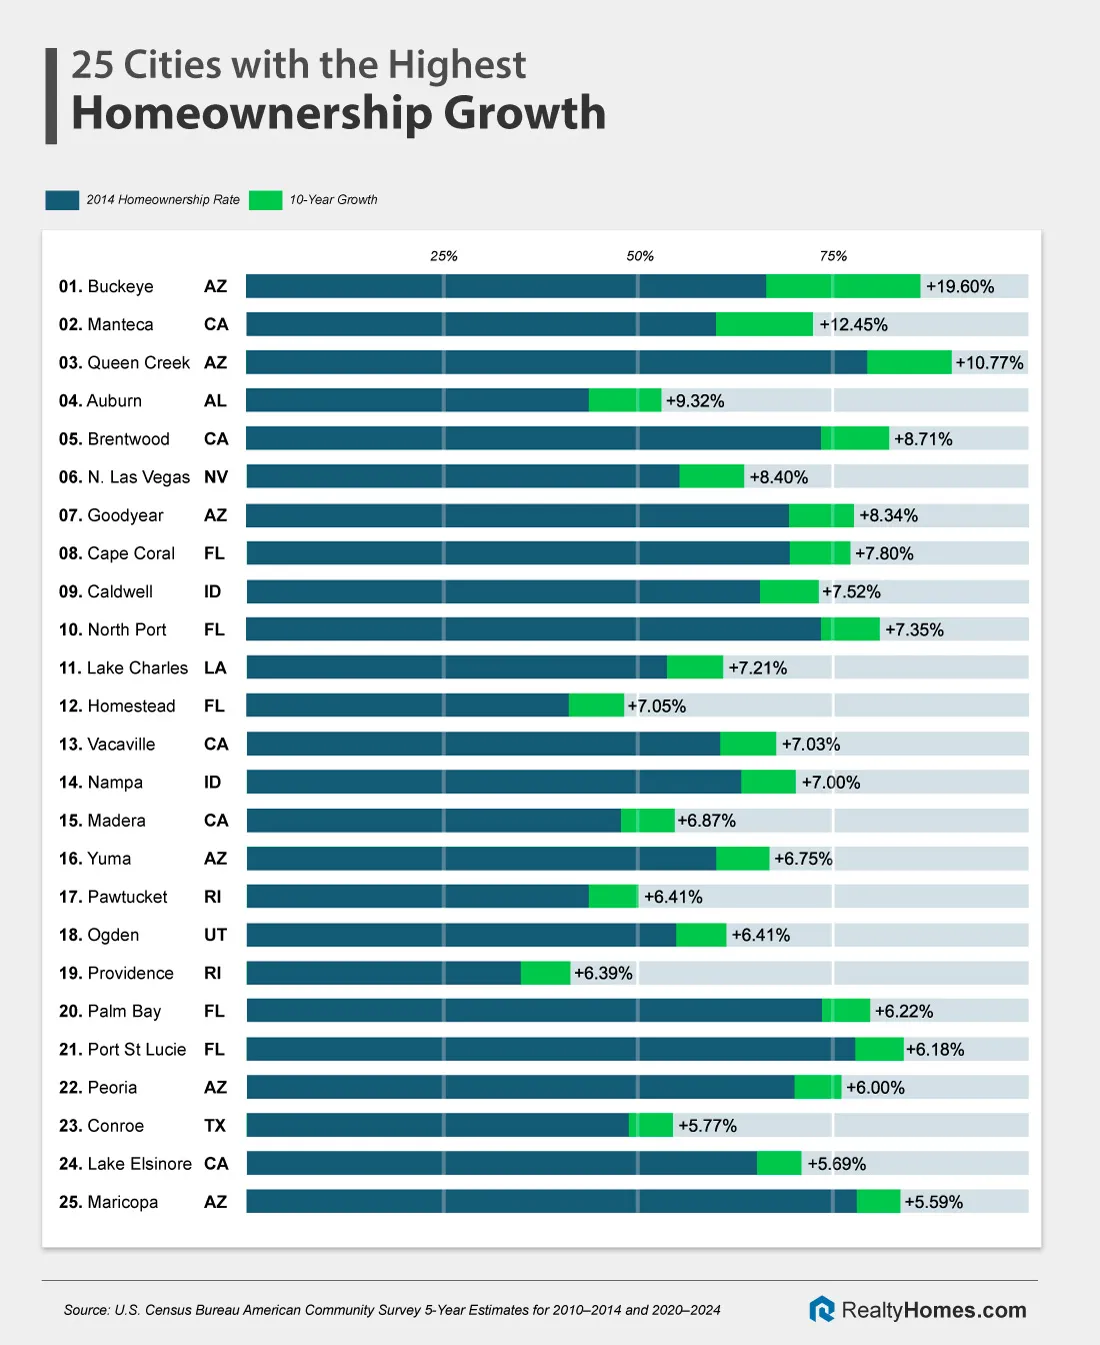
1. Buckeye, Arizona (+19.60 points)
- Homeownership 2014: 66.45%
- Homeownership 2024: 86.05%
- Population: 104,923
- Median home value: $419,800
- Median household income: $99,486
Buckeye recorded the largest homeownership increase of any city in the analysis. Located on the western edge of the Phoenix metro, the city added large volumes of new single-family housing over the past decade. That expansion, paired with a strong influx of new residents, pushed ownership rates to some of the highest levels in the country. Buckeye consistently ranks among the top 10 fastest-growing major cities in the nation.
2. Manteca, California (+12.45 points)
- Homeownership 2014: 59.96%
- Homeownership 2024: 72.41%
- Population: 89,043
- Median home value: $589,900
- Median household income: $97,055
Manteca stands out as one of California’s strongest homeownership gainers. Situated in the Central Valley, the city benefited from buyers priced out of coastal markets, with new development helping convert renters into homeowners despite rising prices statewide.
3. Queen Creek, Arizona (+10.77 points)
- Homeownership 2014: 79.43%
- Homeownership 2024: 90.19%
- Population: 71,867
- Median home value: $635,400
- Median household income: $141,978
Already a high-ownership community in 2014, Queen Creek pushed ownership even higher over the decade. High incomes and continued residential development helped the city reach one of the highest ownership rates among mid-size U.S. cities.
4. Auburn, Alabama (+9.32 points)
- Homeownership 2014: 43.75%
- Homeownership 2024: 53.07%
- Population: 80,594
- Median home value: $364,800
- Median household income: $63,668
Auburn saw one of the largest increases in ownership from a relatively low starting point. While the presence of a large student population traditionally suppresses ownership, growth beyond the university helped increase ownership.
5. Brentwood, California (+8.71 points)
- Homeownership 2014: 73.52%
- Homeownership 2024: 82.24%
- Population: 65,208
- Median home value: $836,600
- Median household income: $142,494
Despite high home prices, Brentwood posted a sizable ownership gain. New single-family development and high household incomes helped maintain a strong homeowner base even as surrounding Bay Area markets remained renter-heavy.
6. North Las Vegas, Nevada (+8.40 points)
- Homeownership 2014: 55.25%
- Homeownership 2024: 63.64%
- Population: 278,595
- Median home value: $404,400
- Median household income: $79,542
North Las Vegas led all large cities in ownership growth. Housing remained relatively attainable compared with neighboring markets, allowing ownership to rise steadily as the city expanded.
7. Goodyear, Arizona (+8.34 points)
- Homeownership 2014: 69.39%
- Homeownership 2024: 77.72%
- Population: 107,645
- Median home value: $471,300
- Median household income: $103,319
Goodyear’s growth reflects the broader Phoenix-area housing boom, where sustained construction and steady population growth supported rising ownership over the decade.
8. Cape Coral, Florida (+7.80 points)
- Homeownership 2014: 69.43%
- Homeownership 2024: 77.23%
- Population: 215,536
- Median home value: $373,500
- Median household income: $78,104
Cape Coral combined population growth with a large supply of single-family homes, allowing ownership to rise even as Florida housing costs increased.
9. Caldwell, Idaho (+7.52 points)
- Homeownership 2014: 65.53%
- Homeownership 2024: 73.05%
- Population: 66,516
- Median home value: $367,300
- Median household income: $73,058
Part of the Boise metro, Caldwell benefited from regional in-migration and comparatively affordable housing, pushing ownership higher as new neighborhoods were built.
10. North Port, Florida (+7.35 points)
- Homeownership 2014: 73.54%
- Homeownership 2024: 80.89%
- Population: 84,605
- Median home value: $362,500
- Median household income: $84,049
North Port’s expansion over the past decade helped lift ownership above 80 percent, driven by steady residential development and as well as a strong demand from retirees.
Mid-Size Cities Saw the Biggest Homeownership Gains
The largest homeownership increases occurred primarily in mid-size cities rather than the nation’s largest metros. Cities with populations between roughly 65,000 and 200,000 consistently posted larger swings in ownership rates, while gains in larger cities appeared to be smaller and slower.
This is likely because mid-size cities often have fewer land constraints, more room for new subdivisions, and zoning environments more favorable to single-family construction, making it easier to add owner-occupied housing at scale.
Large Cities With the Most Homeownership Growth
Cities with a population of at least 200,000 or more.
Rank | City | Population | Homeownership Rate | Change | Median Home Value | Median Income |
|---|---|---|---|---|---|---|
1 | N Las Vegas, NV | 278,595 | 63.64% | +8.40% | $404,400 | $79,542 |
2 | Cape Coral, FL | 215,536 | 77.23% | +7.80% | $373,500 | $78,104 |
3 | Port St. Lucie, FL | 232,491 | 84.00% | +6.18% | $369,200 | $80,648 |
4 | Aurora, CO | 394,432 | 62.41% | +5.11% | $469,100 | $88,368 |
5 | Modesto, CA | 219,215 | 58.88% | +5.07% | $442,700 | $79,891 |
6 | Tacoma, WA | 222,758 | 55.78% | +4.72% | $479,600 | $85,884 |
7 | Stockton, CA | 322,326 | 53.93% | +4.32% | $440,900 | $79,907 |
8 | New Orleans, LA | 371,853 | 51.18% | +4.32% | $315,700 | $56,631 |
9 | St. Petersburg, FL | 262,732 | 62.82% | +4.15% | $371,100 | $75,192 |
10 | Las Vegas, NV | 660,400 | 56.64% | +4.11% | $427,900 | $73,877 |
11 | Sacramento, CA | 528,706 | 51.70% | +4.08% | $506,300 | $87,321 |
12 | Anchorage, AK | 288,976 | 63.90% | +4.06% | $395,900 | $103,284 |
13 | Henderson, NV | 332,141 | 66.08% | +4.06% | $484,900 | $90,138 |
14 | Mesa, AZ | 511,764 | 64.40% | +3.88% | $408,000 | $82,752 |
15 | Bakersfield, CA | 411,986 | 60.58% | +3.67% | $371,700 | $80,540 |
Among cities with more than 200,000 residents, ownership gains were smaller but still notable. North Las Vegas, Cape Coral, Port St. Lucie, Aurora, and Modesto led this group, each posting increases of roughly five to eight percentage points over the last 10-years.
These cities show that large markets can still increase ownership, but structural limits tend to cap how much change is possible.
How Affordability Shaped Homeownership Growth
Affordability played a central role in determining where ownership increased. Many of the top-gaining cities combined rising home prices with incomes that were high enough to sustain buying.
In contrast, cities where prices far outpaced incomes were more likely to see ownership stagnate or decline, even when local economies were strong. Ownership growth was less about low prices alone and more about maintaining a workable balance between prices, incomes, and housing supply.
Where Homeownership Growth Was Concentrated
Geographically, homeownership gains were heavily concentrated in the Sun Belt and the interior West. Arizona, California, Florida, Nevada, and Idaho accounted for a large share of the top-performing cities.
Only a handful of cities in the Northeast and Midwest posted comparable gains, underscoring how population growth and housing development patterns shaped outcomes over the decade.
Largest Declines: Cities Where Homeownership Fell the Most
Rank | City | Population | Homeownership Rate | Change | Median Home Value | Median Income |
|---|---|---|---|---|---|---|
1 | Rowlett, TX | 65,463 | 75.23% | -10.77% | $368,800 | $112,081 |
2 | Chino Hills, CA | 77,927 | 69.16% | -10.09% | $874,900 | $126,334 |
3 | Richardson, TX | 118,731 | 50.74% | -9.70% | $431,400 | $98,111 |
4 | Frisco, TX | 219,304 | 65.90% | -8.94% | $642,100 | $150,212 |
5 | Doral, FL | 79,216 | 46.51% | -8.08% | $562,800 | $94,164 |
Not all fast-growing cities saw ownership rise. Several high-income suburbs experienced declines, often driven by a surge in rental construction that may have diluted ownership shares.
Rowlett, TX, Chino Hills, CA, and Richardson, TX recorded some of the steepest homeownership declines. In many cases, rapid apartment construction outpaced single-family development, particularly in metros like Dallas-Fort Worth, which saw one of the largest multifamily building booms over the past decade.
Expanded List of Cities that Made the List
Rank | City | State | Population | Homeownership Rate | Change | Median Home Value | Median Income |
|---|---|---|---|---|---|---|---|
1 | Buckeye | Arizona | 104,923 | 86.05% | +19.60% | $419,800 | $99,486 |
2 | Manteca | California | 89,043 | 72.41% | +12.45% | $589,900 | $97,055 |
3 | Queen Creek | Arizona | 71,867 | 90.19% | +10.77% | $635,400 | $141,978 |
4 | Auburn | Alabama | 80,594 | 53.07% | +9.32% | $364,800 | $63,668 |
5 | Brentwood | California | 65,208 | 82.24% | +8.71% | $836,600 | $142,494 |
6 | North Las Vegas | Nevada | 278,595 | 63.64% | +8.40% | $404,400 | $79,542 |
7 | Goodyear | Arizona | 107,645 | 77.72% | +8.34% | $471,300 | $103,319 |
8 | Cape Coral | Florida | 215,536 | 77.23% | +7.80% | $373,500 | $78,104 |
9 | Caldwell | Idaho | 66,516 | 73.05% | +7.52% | $367,300 | $73,058 |
10 | North Port | Florida | 84,605 | 80.89% | +7.35% | $362,500 | $84,049 |
11 | Lake Charles | Louisiana | 81,143 | 60.89% | +7.21% | $214,300 | $59,235 |
12 | Homestead | Florida | 82,807 | 48.26% | +7.05% | $380,000 | $65,423 |
13 | Vacaville | California | 102,596 | 67.53% | +7.03% | $620,900 | $111,126 |
14 | Nampa | Idaho | 110,319 | 70.22% | +7.00% | $370,800 | $74,279 |
15 | Madera | California | 67,831 | 54.71% | +6.87% | $359,900 | $63,933 |
16 | Yuma | Arizona | 100,139 | 66.75% | +6.75% | $230,000 | $65,482 |
17 | Pawtucket | Rhode Island | 75,893 | 50.09% | +6.41% | $325,500 | $68,310 |
18 | Ogden | Utah | 87,413 | 61.27% | +6.41% | $355,600 | $72,575 |
19 | Providence | Rhode Island | 191,767 | 41.40% | +6.39% | $362,200 | $68,119 |
20 | Palm Bay | Florida | 130,132 | 79.73% | +6.22% | $283,200 | $72,614 |
21 | Port St. Lucie | Florida | 232,491 | 84.00% | +6.18% | $369,200 | $80,648 |
22 | Peoria | Arizona | 196,906 | 76.01% | +6.00% | $463,600 | $95,815 |
23 | Conroe | Texas | 102,360 | 54.54% | +5.77% | $309,600 | $76,206 |
24 | Lake Elsinore | California | 72,461 | 70.89% | +5.69% | $566,000 | $101,888 |
25 | Maricopa | Arizona | 67,163 | 83.58% | +5.59% | $377,200 | $96,391 |
26 | Citrus Heights | California | 86,995 | 60.74% | +5.55% | $454,600 | $82,314 |
27 | Hayward | California | 158,801 | 58.03% | +5.53% | $854,400 | $113,318 |
28 | Largo | Florida | 82,617 | 61.74% | +5.51% | $229,100 | $62,096 |
29 | Apex | North Carolina | 70,630 | 76.54% | +5.30% | $576,100 | $144,135 |
30 | Commerce City | Colorado | 66,445 | 77.18% | +5.29% | $499,700 | $111,972 |
31 | Richmond | California | 115,505 | 54.70% | +5.27% | $668,200 | $95,391 |
32 | Jurupa Valley | California | 107,011 | 70.09% | +5.19% | $574,600 | $97,550 |
33 | Menifee | California | 110,305 | 80.24% | +5.17% | $537,300 | $93,454 |
34 | Frederick | Maryland | 83,395 | 58.76% | +5.13% | $401,500 | $97,069 |
35 | Clovis | California | 124,725 | 65.35% | +5.11% | $482,700 | $99,241 |
36 | Aurora | Colorado | 394,432 | 62.41% | +5.11% | $469,100 | $88,368 |
37 | Medford | Oregon | 86,315 | 56.31% | +5.09% | $417,100 | $73,230 |
38 | Modesto | California | 219,215 | 58.88% | +5.07% | $442,700 | $79,891 |
39 | Daly City | California | 101,964 | 60.21% | +5.00% | $1,115,000 | $123,547 |
40 | Surprise | Arizona | 154,948 | 79.08% | +5.00% | $435,100 | $96,711 |
41 | Miami Beach | Florida | 82,031 | 40.87% | +4.94% | $556,700 | $72,856 |
42 | Pittsburg | California | 76,257 | 62.34% | +4.81% | $597,900 | $99,861 |
43 | New Britain | Connecticut | 74,223 | 45.05% | +4.80% | $223,600 | $58,613 |
44 | Perris | California | 80,511 | 68.84% | +4.79% | $474,700 | $88,911 |
45 | Roswell | Georgia | 92,621 | 71.89% | +4.78% | $567,100 | $128,654 |
46 | Tacoma | Washington | 222,758 | 55.78% | +4.72% | $479,600 | $85,884 |
47 | Greeley | Colorado | 110,806 | 60.91% | +4.66% | $402,500 | $69,881 |
48 | Pasco | Washington | 79,575 | 70.94% | +4.61% | $376,300 | $85,586 |
49 | Escondido | California | 149,668 | 53.41% | +4.45% | $714,500 | $91,967 |
50 | Fairfield | California | 120,785 | 61.30% | +4.39% | $624,300 | $101,895 |
Methodology
This analysis uses U.S. Census Bureau American Community Survey 5-Year Estimates for 2010–2014 and 2020–2024. Homeownership rates represent the share of occupied housing units that are owner-occupied.
The analysis includes incorporated U.S. cities with populations of at least 65,000 and at least 5,000 occupied housing units in both periods. Census-designated places (CDPs) were excluded. Changes are reported as percentage-point differences over the ten-year period.